

Data study
Best EURUSD expert advisor: what happens to the top picks after they are picked
 Tommy J.Founder, RoboticEA
Type “best EURUSD expert advisor” into a search box and you will be shown equity curves. We can make those too: our discovery loop and its transplant study produced 899,815 strategy candidates on EURUSD and backtested them on H1 and H4 across 9 years, 2018 to 2026, with the real recorded spread charged inside the simulation (8,098,335 one-year backtests). Sort that pile by compounded return and the top of it looks spectacular. Then ask the only question that matters: what did those picks do in the years after they were picked?
The short answer
The honest answer
Is there a best EURUSD expert advisor?
Not in the sense the search implies. “Best” on a vendor page means the best-looking record over a window the strategy was chosen from. That is a statement about the past, and it is the easiest number in trading to manufacture: test enough strategies and something will have compounded spectacularly by luck and by fit. This post keeps the two questions apart. First, what does the best-looking EURUSD record in our data actually look like when you open it up. Second, what does picking on it buy you afterwards.
+961% → -52%
the ten best EURUSD strategies of 2018–2023, then scored on the years they had not seen
Median compounded return of the top ten (by 2018–2023 compounded return, one row per distinct structure) in training and then over 2024–2026, on the 483,071 candidates in the unfloored population. 2024–2026 includes a partial 2026. Real recorded spread, $10,000 account, 100:1 leverage.
Method
What we tested, and how
- Generated, not hand-picked. Strategies come from the same compile tool the product uses to build strategies from indicator and exit components. The EURUSD search ran 58 clean rounds of 2,040 strategies each, every one backtested on H1 or H4, one year at a time, at 2%, 3% and 4% risk per trade (plus one arm for strategies whose sizing is not a risk percentage).
- Scored by the product’s own badge rule. A candidate needs at least 4 rated years, at least 20 trades in total, and either a mean year of 20% or more (“strong”) or roughly two-thirds of its rated years profitable with a non-negative mean (“good”). On a 6-year training window that means 4 profitable years. Stateful strategies (grids, martingales) are never badged. We added one more floor of our own: on average at least 20 trades a year, so a strategy that trades twice a year cannot win by luck.
- Ranked by compounded return. The account’s actual result, not the mean of yearly returns. A +300% year followed by a −100% year is a great mean and a dead account; the trap section below measures how often that happens.
- Real recorded EURUSD spread, commission and swap charged inside every backtest, $10,000 starting equity, 100:1 leverage, stop-out at 30%. Every one of the 8,098,335 runs was asserted to be on real market bars; an engine without data invents it.
- Walk-forward, not one split. Select on 2018 through T, score on the years after, for T = 2021, 2022, 2023, 2024. One split is not a holdout; four overlapping ones are the minimum we consider a sanity check. The tables show all of them, and the 2023 split is used as the worked example.
| Population | Candidates | Badged | Share badged | Distinct badged structures |
|---|---|---|---|---|
| EURUSD search (clean rounds) | 310,344 | 9,757 | 3.14% | 3,834 |
| Transplant pool (unfloored) | 589,471 | 17,967 | 3.05% | 6,868 |
The two populations badge at almost the same rate, which is a useful sanity check on the second one. What the second one is, and why we need it, is the next-but-one section.
In-sample
What the in-sample leaderboard shows
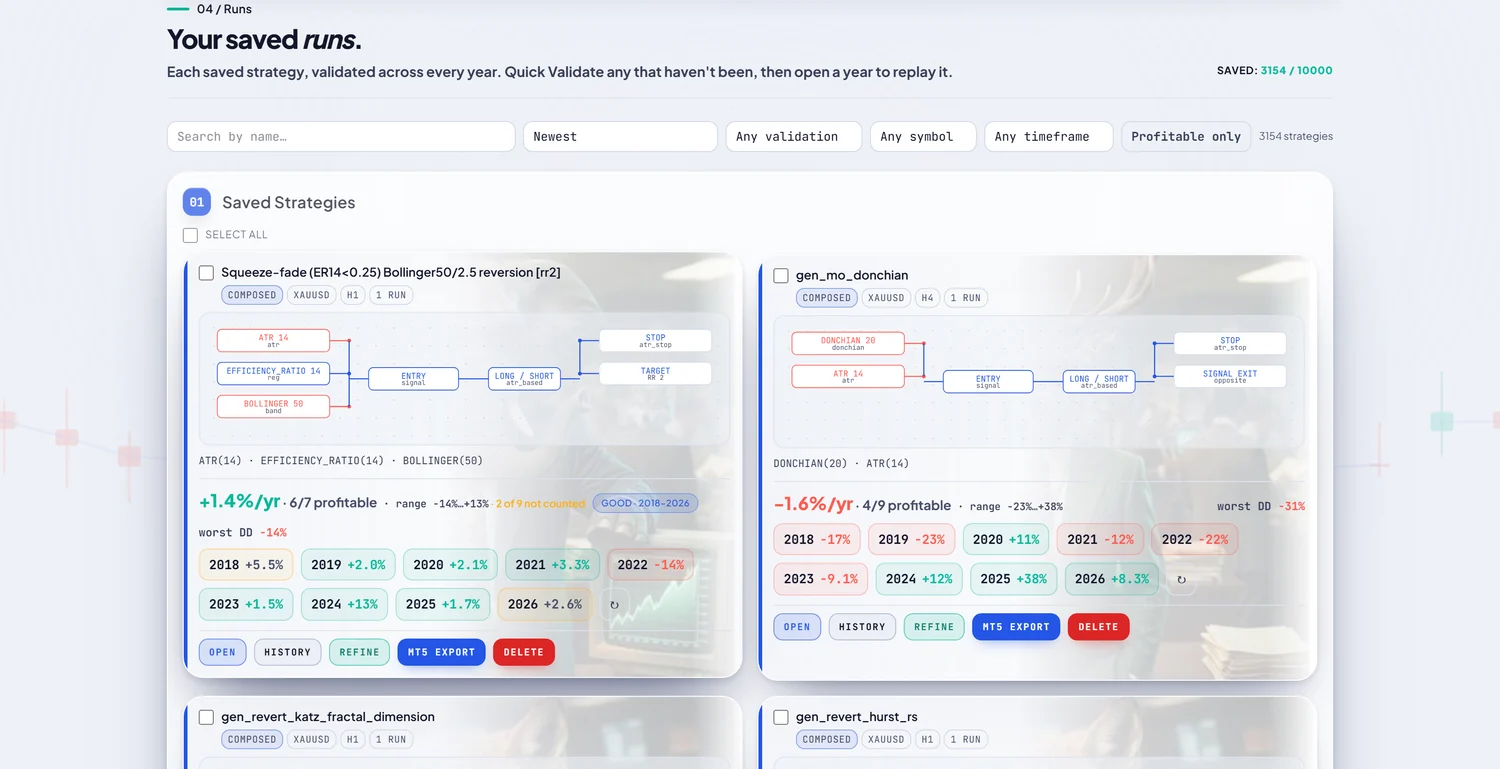
Rank the badged EURUSD strategies from the search by compounded return over all 9 years and this is the top of the list: the strategy on the left. On the right is what a walk-forward test looks like for the same kind of pick — a strategy chosen because it was the best of its population on 2018–2023, followed into the years it had not seen.
Read the left card the way a sceptical buyer would. It compounded +958%, and it is profitable in 5 of 9 years. It lost money in 4 years (2018, 2021, 2022, 2023). Its worst single-year drawdown was −53%, and the best year alone accounts for 31% of its total growth; take that year away and it compounds +322%. That is a real strategy record and it is a hard one to hold — the shape a lot of “best EA” pages leave out.
One correction on our own tooling, because the drawdown line is where it would have hurt. Our search leaderboard stored a “worst drawdown” for each strategy that was actually the mildest single-year drawdown (it took the maximum of negative numbers). For this strategy it read −24.4% where the true worst year was −52.9%. We found it while writing this post — it was the same on all 48,447 rows we compared — and every drawdown in this post is recomputed from the per-year runs.
8,416
badged candidates with 9 rated years and 20+ trades a year
865
of them compounded more than +100% over the whole period
6
were profitable in all 9 years
−28%
median worst single-year drawdown across the badged set
| Strategy | Archetype | TF | Risk | Compounded | Years up | Worst year | Worst-year DD | Trades/yr |
|---|---|---|---|---|---|---|---|---|
| d59_Volatility_0 | Volatility | H1 | 4% | +958% | 5/9 | -22% (2023) | −53% | 81 |
| d89_Trend_Confirmation_35 | Trend Confirmation | H4 | 4% | +893% | 5/9 | -22% (2023) | −45% | 47 |
| d72_Divergence_33 | Divergence | H4 | 4% | +750% | 7/9 | -21% (2021) | −44% | 64 |
| d43_Mean_Reversion_58 | Mean Reversion | H1 | 4% | +625% | 8/9 | -25% (2022) | −49% | 82 |
| d71_Divergence_47 | Divergence | H4 | 4% | +598% | 6/9 | -18% (2020) | −58% | 64 |
| d75_Stationary_Reversion_21 | Stationary Reversion | H4 | 4% | +593% | 8/9 | -30% (2022) | −50% | 125 |
| d59_Cycle_5 | Cycle | H4 | 4% | +588% | 6/9 | -64% (2024) | −66% | 85 |
| d95_Regime_45 | Regime | H4 | 4% | +555% | 5/9 | -53% (2024) | −61% | 67 |
| d82_Trend_Confirmation_7 | Trend Confirmation | H4 | 4% | +509% | 5/9 | -30% (2023) | −52% | 32 |
| d88_Stress_Reversion_12 | Stress Reversion | H1 | 4% | +506% | 6/9 | -25% (2020) | −64% | 68 |
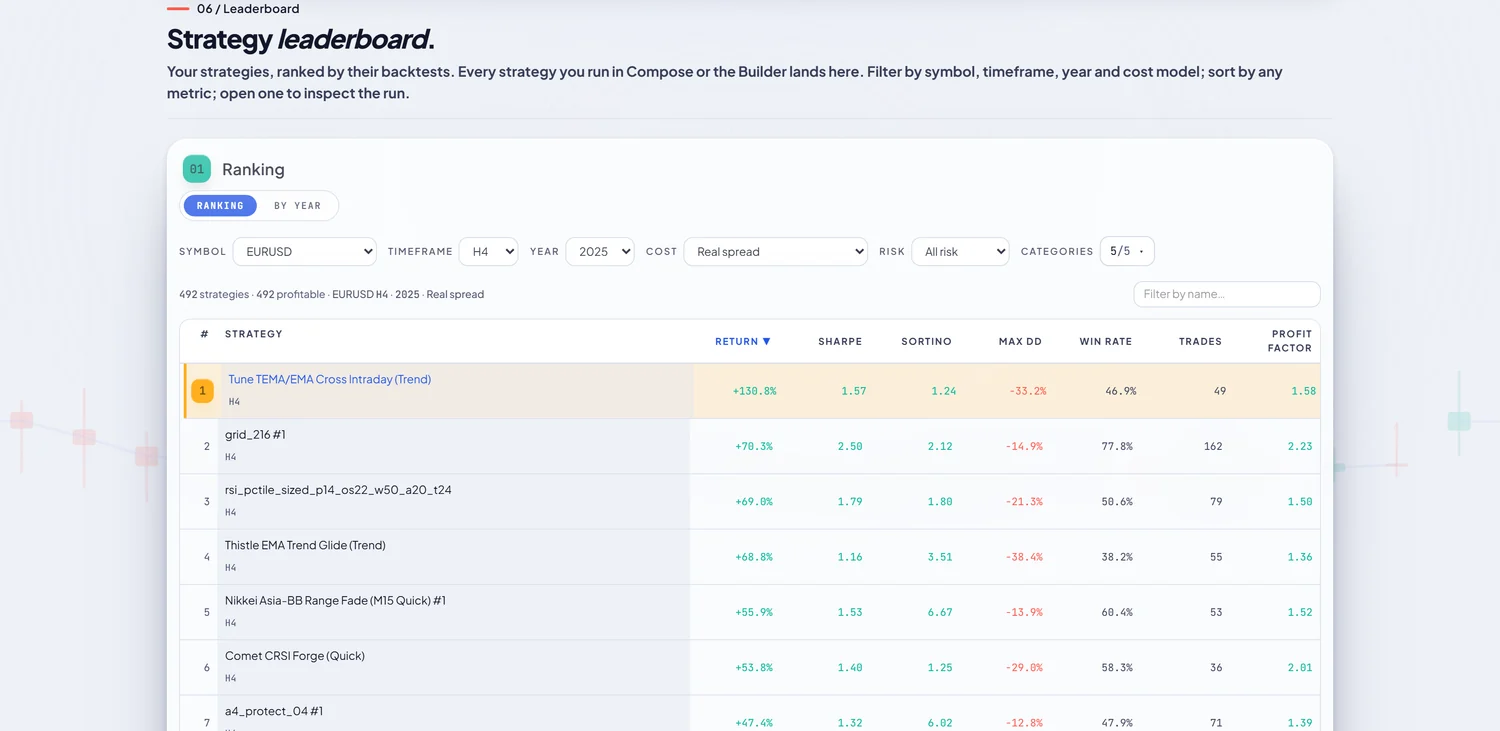
The trap inside the trap
Why a search leaderboard is not a holdout
The obvious fix is to take the search’s leaderboard, pick on early years, and score on later ones. It does not work, and the reason is a design detail worth knowing about any strategy search, ours included. To save disk, the loop throws away every candidate whose mean year over all 9 years is negative — 259,470 of the 310,344 candidates in the clean rounds, none of them badged. Nothing badge-worthy is lost. But the survivors are now conditioned on the very years we would like to hold out: a strategy that was great through 2023 and collapsed in 2024 is dropped if the collapse dragged its nine-year mean below zero, so what remains looks better out of sample than it should.
We measured how much better. The second population — the transplant pool — was run on EURUSD without any floor, so its losers are still there. Applying the search loop’s exact floor to that same population and repeating the test gives the size of the bias:
| Trained on | Tested on | Unfloored: profitable | Floored: profitable | Unfloored median | Floored median |
|---|---|---|---|---|---|
| 2018–2021 | 2022–2026 | 13.3% | 52.1% | -33.7% | +1.2% |
| 2018–2022 | 2023–2026 | 16.6% | 51.6% | -26.0% | +0.9% |
| 2018–2023 | 2024–2026 | 22.6% | 62.0% | -17.1% | +4.9% |
| 2018–2024 | 2025–2026 | 40.5% | 70.1% | -4.0% | +7.0% |
So the clean holdout in this post runs on the unfloored population. That population is gold-derived strategy structures run on EURUSD: the strategies kept from our XAUUSD discovery, re-run here on the same years, arms and rules with nothing thrown away. It is not a native EURUSD search, and we say so where it matters below. Its 589,471 candidates badge at nearly the same rate as the native search’s, and it is the only EURUSD population on disk that contains the losers.
Out of sample
What happened to the picks afterwards
For each of the 4 split points we selected on the years up to T, using the same rules as the badge, and scored the picks on every year after T. Losses first, because that is what the top of a leaderboard costs:
| Trained on | Selection | Picks | Median in training | Median afterwards | Profitable afterwards | Median worst-year DD |
|---|---|---|---|---|---|---|
| 2018–2021 | Top 10 | 10 | +967% | -90% | 0% | −77% |
| 2018–2021 | Top 25 | 25 | +658% | -80% | 0% | −68% |
| 2018–2021 | Top 100 | 100 | +398% | -74% | 10% | −64% |
| 2018–2021 | Badged, all | 12,765 | +29% | -35% | 15% | −38% |
| 2018–2022 | Top 10 | 10 | +874% | -78% | 10% | −66% |
| 2018–2022 | Top 25 | 25 | +654% | -71% | 8% | −64% |
| 2018–2022 | Top 100 | 100 | +410% | -65% | 10% | −61% |
| 2018–2022 | Badged, all | 6,910 | +42% | -31% | 17% | −37% |
| 2018–2023 | Top 10 | 10 | +961% | -52% | 0% | −59% |
| 2018–2023 | Top 25 | 25 | +656% | -56% | 8% | −61% |
| 2018–2023 | Top 100 | 100 | +341% | -47% | 21% | −52% |
| 2018–2023 | Badged, all | 8,645 | +22% | -11% | 32% | −25% |
| 2018–2024 | Top 10 | 10 | +650% | -12% | 30% | −53% |
| 2018–2024 | Top 25 | 25 | +538% | -11% | 40% | −44% |
| 2018–2024 | Top 100 | 100 | +309% | -16% | 37% | −41% |
| 2018–2024 | Badged, all | 3,612 | +30% | -2% | 43% | −19% |
At every split point the median top-ten pick lost money afterwards. The broader the set, the less bad it gets: the median across every badged structure is far closer to zero than the median of the top ten. That is not because the badge finds edge; the average strategy is unremarkable and regresses toward its own base rate. Does the badge itself help? Here is the badged set against the fair comparison, a tradable strategy of the same kind with no badge, and against everything:
| Trained on | Badged: profitable | Tradable, no badge: profitable | All candidates: profitable | Badged: median afterwards | Tradable: median afterwards |
|---|---|---|---|---|---|
| 2018–2021 | 14.6% | 11.9% | 13.3% | -34.5% | -37.4% |
| 2018–2022 | 16.6% | 14.7% | 16.6% | -31.4% | -30.2% |
| 2018–2023 | 32.2% | 20.2% | 22.6% | -11.5% | -20.8% |
| 2018–2024 | 43.4% | 39.9% | 40.5% | -2.1% | -4.9% |
Compare the first two columns: the badge’s lift over a tradable, unbadged strategy ranges from 1.8 to 12.0 percentage points across the split points. The median badged strategy still lost money afterwards at every split point. The badge is a filter against strategies that only worked in one year; it is not a promise. The search population tells the same story with a harsher edge, and it is still the floored one: the top ten by training return had a median of -67% afterwards at the 2023 split.
Mean versus compounded
The mean-of-years trap
Many strategy pages headline the average yearly return, because the average is a bigger number than the account ever saw. Among strategies with all 9 years and at least 20 trades a year, we took the 25 highest by mean yearly return and looked at what the account did:
| Population | Ranked by | Median mean / yr | Median compounded | Ended below zero | Lost 99%+ |
|---|---|---|---|---|---|
| Unfloored | Mean year | +60% | -26% | 52% | 16% |
| Unfloored | Compounded | +36% | +685% | 0% | 0% |
| Search survivors | Mean year | +61% | -88% | 68% | 32% |
| Search survivors | Compounded | +29% | +506% | 0% | 0% |
Ranked by the mean, the top 25 averaged a median +60% a year and compounded a median -26% — an average that is arithmetic and an account that is not. In the search survivors the same ranking gives a median compounded return of -88%, with 32% of the picks ruined. Out of sample it is worse than ranking on compounded return at each split we tried: -94% against -80%, -81% against -71%, -58% against -56%, -13% against -11% (top 25 by mean versus top 25 by compounded, splits 2021, 2022, 2023, 2024). Compounded return is the headline in this post for that reason.
Position sizing
Risk per trade: 2%, 3% or 4%
The same 8,635 structures were run at three risk settings, which isolates sizing from signal: identical entries and exits, only the risk per trade changes. Here is what happened after the 2023 split to the structures that earned the badge on 2018–2023 at any of the three:
| Risk per trade | Structures | Median afterwards | Profitable afterwards | Lost at least half | Median worst-year DD |
|---|---|---|---|---|---|
| 2% | 8,641 | -6.0% | 34.7% | 4.9% | −17% |
| 3% | 8,641 | -9.9% | 32.8% | 11.5% | −24% |
| 4% | 8,641 | -14.3% | 31.1% | 19.0% | −31% |
The median went down and the drawdown went up as risk per trade rose. Nothing about the signal changed. Higher risk widens the distribution — more very good outcomes and more very bad ones — and a leaderboard sorted by return picks from the top of the widened distribution, which is why every one of the top ten in-sample strategies above sits on the highest-risk arm. It is leverage on the same signal, not better strategy.
Timeframe and cost
H1 or H4, and what costs
| Timeframe | Badge earned | Badged: profitable afterwards | Badged: median afterwards | All candidates: profitable | Friction / yr on $10k | Trades / yr |
|---|---|---|---|---|---|---|
| H1 | 3.1% | 18.5% | -28.3% | 13.0% | $558 | 76 |
| H4 | 5.6% | 37.8% | -6.6% | 29.0% | $157 | 33 |
H4 did better than H1 at every split point, and it costs less to run: an H1 strategy in this population paid a median of $558 a year in commission and swap on a $10,000 account against $157 for H4, because it trades more. Our timeframe study measures that trade-off across every timeframe. It found 37.9% of EURUSD H4 strategy-years profitable; here the same measure is 34.3%. The figures differ by design — that study ran every strategy at 1% risk, this one at 2%, 3% and 4% — and they agree on the shape: a minority of strategy-years are profitable, and H4 beats H1.
A lead, not a recommendation
The one pattern that persisted
We also asked which strategy families kept working after the split. Across the 28 archetypes in the unfloored population, ranking them by the share of their badged picks that were profitable afterwards, one — Divergence — ranked first at every one of the 4 split points. Every other archetype’s rank moved around from split to split.
| Trained on | Divergence: picks | Profitable afterwards | Median afterwards | H4 only: profitable | H4 only: median | Unbadged Divergence: profitable |
|---|---|---|---|---|---|---|
| 2018–2021 | 1,506 | 43% | -5.3% | 46% | -3.0% | 23% |
| 2018–2022 | 1,074 | 41% | -4.6% | 43% | -3.4% | 24% |
| 2018–2023 | 1,359 | 58% | +4.4% | 62% | +5.7% | 32% |
| 2018–2024 | 612 | 64% | +5.4% | 66% | +5.7% | 47% |
Treat this as a lead to investigate, for four reasons stated plainly. It is one archetype out of 28, and if you test that many something will lead. The splits share test years, so four agreeing splits are not four independent confirmations. The median gain is small — +6% for H4 at the 2023 split — and a large minority of picks still lost money. And the effect lives in the combination: Divergence without the multi-year badge was ordinary, and the H1 version did worse than H4. If you take one thing from it, take the method: a filter that demands many profitable years, on a family that keeps showing up, on the slower timeframe.
Limits
Limits of this study
- The clean holdout is not a native EURUSD search. Its strategies were kept from our gold discovery for being non-negative on gold, then run on EURUSD. Our instrument study found that a strategy’s rank on one instrument transfers only partly to another, so that pre-selection is a weak one, but it is not nothing. We report the native search alongside it, labelled as floor-biased.
- 2026 is partial: the EURUSD_H1_2026 store holds 3,624 bars (~30 weeks, through end of July 2026). Every test window includes it, so it is a fraction of a year mixed into a compounded total.
- The splits overlap. Four expanding windows share their test years and are strongly dependent; they are four looks at one history, not four experiments.
- A big search produces lucky winners by construction. With hundreds of thousands of candidates some top picks will keep winning by chance. The shares in the tables, not any one card, carry the claim.
- These are backtests. Costs are recorded spread, commission and swap on a $10,000 account at 100:1 leverage; drawdowns are per year, and the year-end equity path is not a tick-level path across years. Stateful strategies (grids, martingales) are excluded from the badge and from every table here.
Test the strategy you were about to buy
Run any strategy on EURUSD across every year, on real recorded spread, and see the losing years next to the winning ones before you export anything.
Practical
What to ask of any EURUSD EA
- Was it picked on the years it is being shown on? If yes, the record describes the selection, not the strategy. Ask for a period that was not used to choose it.
- What is the compounded return, and what is the worst year? Not the average. On our data the 25 highest by average compounded a median -26%.
- What was the drawdown, per year, and how is it computed? We got that wrong ourselves for a while; check it is the worst, not the typical.
- How many profitable years, out of how many? The strategy above with +958% was profitable in 5 of 9. Two thirds is a reasonable bar; it is a filter, not a forecast.
- At what risk per trade? A high return at a high risk is the same signal levered. Ask for the lowest-risk version of the same record.
- Is the spread real? A flat-pip assumption on EURUSD understates what an H1 strategy pays. Our instrument study measures what each pair really costs, and do forex robots work covers the base rate.
FAQ
EURUSD EA questions, answered
What is the best EURUSD expert advisor?
No expert advisor can honestly be named the best from backtest data. We backtested an unfiltered population of 589,471 EURUSD strategy candidates on H1 and H4 across the nine years from 2018 to 2026 with real recorded spread, picked the top ten on 2018-2023 by compounded return, and scored them on 2024-2026: their median compounded return went from +961% in the years they were picked on to -52% afterwards, and only 8% of the top 25 were profitable. The median top-ten pick lost money at all 4 split points we tried. Use a backtest to shortlist and to rule strategies out, and ask for a period that was not used to pick the strategy.
Is a EURUSD backtest showing a return of several hundred percent trustworthy?
Not by itself. The highest compounded return among badged EURUSD strategies in our search was +958% over 2018 to 2026 (d59_Volatility_0, H1, 4% risk per trade), but it was profitable in only 5 of 9 years, lost money in 4 of them, had a worst single-year drawdown of -53%, and one year supplied 31% of its growth. It was also selected with every one of those years in view, so the record describes the selection more than the strategy. Ask for the compounded return, the worst year, the drawdown and a period that was not used to choose it.
Is H1 or H4 better for a EURUSD expert advisor?
H4, in our data. At the 2023 split, 37.8% of H4 strategies that had earned the validated badge on 2018-2023 were profitable over 2024-2026, against 18.5% of H1 ones, with medians of -6.6% and -28.3%; H4 did better at every one of the 4 split points. H1 also costs more to run: a median of $558 a year in commission and swap on a $10,000 account against $157 for H4, because it trades more. That is a tendency in a limited sample, not a guarantee for any one strategy.
What risk per trade should a EURUSD expert advisor use?
Lower risk lost least in our test. The same 8,635 strategy structures run at 2%, 3% and 4% risk per trade had median compounded returns of -6.0%, -9.9% and -14.3% over 2024-2026, median worst single-year drawdowns of -16.6%, -24.1% and -31.1%, and 4.9%, 11.5% and 19.0% of them lost at least half the account. Higher risk is the same signal levered, and it is what makes an in-sample leaderboard's top ten look good. This describes these strategies, not personal advice.
Does a multi-year track record or badge make a EURUSD EA reliable?
It helps a little, not enough to rely on. Strategies that earned the validated badge on 2018-2023 were profitable over 2024-2026 32.2% of the time, against 22.6% for all candidates and 20.2% for tradable candidates with no badge, and their median compounded return was still -11.5%. At the earliest split point, trained on 2018-2021, the gap was 14.6% against 13.3%. Treat the badge as a filter against strategies that only worked in one lucky year, not as a forecast.
Which type of EURUSD strategy held up best?
One archetype, Divergence, ranked first by out-of-sample share profitable at all 4 split points, out of 28 archetypes in the unfiltered population. At the 2023 split 58% of its badged picks were profitable over 2024-2026, against 33% of other badged picks, and its H4 picks had a median of +6%. Treat it as a lead: it is one of 28 archetypes, the splits share test years, the median gain is small, many picks still lost money, and Divergence without the multi-year badge was ordinary (32% profitable).
Why can't you trust the top of a strategy search leaderboard?
Two reasons. The leaderboard is ranked on the same years the strategies were found on, so it measures fit, and our own search additionally discards every candidate whose average year over all nine years is negative, which conditions the survivors on the years you would want to hold out. When we applied that filter to a population that had kept its losers, the share of all candidates that were profitable after the 2023 split rose from 22.6% to 62.0%. The clean holdout in this study therefore uses the unfiltered population, which is gold-derived strategies run on EURUSD rather than a native EURUSD search, and we say so as a limitation.
Everything above is reproducible from the raw rounds: tools/eurusd-study/extract.py reads the discovery tree read-only, aggregate.py writes the JSON this page reads, and our vectorised badge rule was checked against the loop’s own ranker on 48,447 stored rows with 0 tier disagreements. The engine is checked run-for-run against MetaTrader 5’s own Strategy Tester on real ticks. To run the parts you doubt on your own strategy, start free.
Keep reading
The other half of the decision: timeframe
Instrument sets the price per trade; timeframe sets how often you pay it.
Do forex robots actually work?
The prior question, answered over the same engine: how often an automated strategy survives at all.
Best forex pairs for expert advisors
What each of the 25 instruments charges a strategy, and why a best-pair table is an artifact.
The gold study, on XAUUSD
The instrument the transplant pool in this post was drawn from, year by year.