

Data study
Forex trading strategies explained: what 594,580 backtests showed for each type
 Tommy J.Founder, RoboticEA
Most lists of forex trading strategies stop at the description: here is a breakout, here is mean reversion, good luck. We wanted the second half — what happens when you actually run them. So we backtested whole strategy families: 84,940 strategies across 34 archetypes, each run separately on every year from 2020 to 2025 on EURUSD, with the real recorded spread charged — 594,580 backtests in that study alone.
The short answer
The map
The six families of forex trading strategies
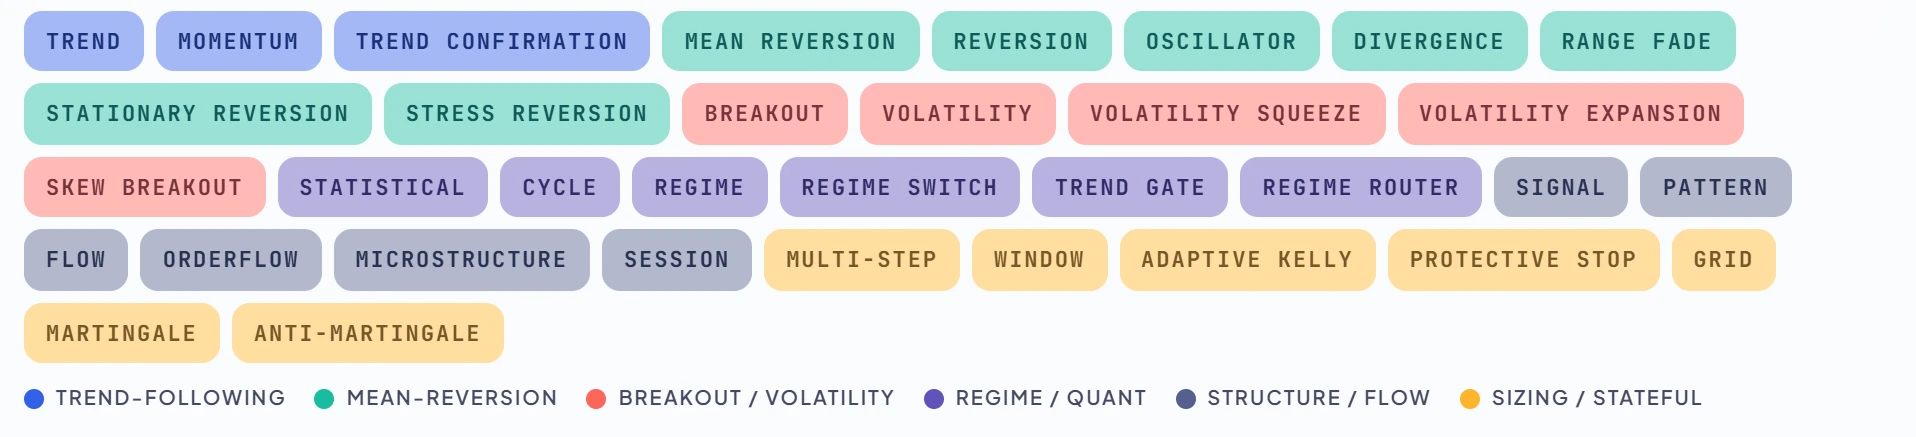
Almost every rule-based forex strategy you will read about is a variation on one of a handful of ideas about how price behaves. We group our 34 archetypes into six families by how the strategy actually trades, not by which indicator it happens to use:
- Trend-following — prices that are moving keep moving. Buy strength, sell weakness, ride it until the trend ends. (Momentum, Trend, Trend Confirmation)
- Breakout and volatility — quiet markets eventually explode. Wait for price to leave a range or for volatility to expand, and go with it. (Breakout, Skew Breakout, Volatility, Volatility Expansion, Volatility Squeeze)
- Mean reversion — stretched prices snap back. Fade extremes back toward an average. (Divergence, Mean Reversion, Oscillator, Range Fade, Reversion, Stationary Reversion, Stress Reversion)
- Regime and quant — first decide what kind of market you are in, then pick the behaviour. Statistical tests and filters decide when to trade at all. (Cycle, Regime, Regime Router, Regime Switch, Statistical, Trend Gate)
- Structure and flow — price patterns, volume and time of day. (Flow, Microstructure, Orderflow, Pattern, Session, Signal)
- Sizing and stateful — the edge is claimed in how much you trade rather than when: grids, martingales, pyramiding, staged entries. (Adaptive Kelly, Anti-Martingale, Grid, Martingale, Multi-Step, Protective Stop, Window)
That is the descriptive part. The rest of this page is what each family did when we ran it.
Method
How we tested whole strategy families
Testing one strategy per type would tell you about that strategy, not the type. So for every archetype we generated 2,500 strategies — 500 distinct rule sets, each at 5 fixed risk levels from 2% to 5% of the account per trade — with the numeric settings drawn at random rather than tuned. Then we ran every strategy on every calendar year as its own backtest from the same starting balance.
594,580
backtests
84,940
strategies
34
archetypes
0
failed runs
- One instrument, one timeframe. EURUSD on H1 for every archetype. That is deliberate: timeframe moves results more than strategy type does (more on that below), so a ranking that mixed timeframes would really be a ranking of timeframes.
- Real costs, charged inside the run. The instrument’s own recorded spread, plus commission and swap, paid as each trade happens.
- Losses counted. “Profitable” means the 6 yearly results, 2020 to 2025, compounded to more than the starting balance. 2026 was only half a year when we ran it, so it is excluded from compounding.
- Idle strategies left out of the averages. 3.3% of strategies never traded. A strategy that never fires returns exactly zero, which would rank above most real ones in a losing population, so every figure here is computed on the 82,170 that traded.
Random settings make this a pessimistic test: it measures the typical member of a family, not the best one someone tuned. That is the point. If a strategy type only works at one magic setting, you want to know that before you trust the setting.
The scoreboard
Forex trading strategies compared: all 34 archetypes
Start with the family level, because it is the question most people ask: is trend following better than mean reversion?
The spread between families is narrow — 2.7% to 4.6% — and every family’s median strategy lost most of the account over 6 years at these risk levels. The one family that clearly stands apart is sizing, and for the wrong reason: 28.8% of its strategies were ruined in at least one year, roughly double any other family.
Now split the families open:
This is the finding that matters most for anyone choosing between strategy types. The variation inside a family is wider than the variation between families. In the trend family, Momentum reached 5.2% profitable while Trend managed 2.1%. Among breakouts, Volatility Squeeze beat Volatility Expansion 4.6% to 0.7%. The label on the strategy tells you much less than its specific construction does.
34 of 34
archetypes with a negative median over 6 years
The best median belonged to Regime Switch at -53.2%, with 8.9% of its strategies in profit. Random settings, EURUSD H1, real recorded spread, 2020–2025. A strategy type is a starting point for testing, not an edge in itself.
Family 1
Trend following, momentum and the MACD trading strategy
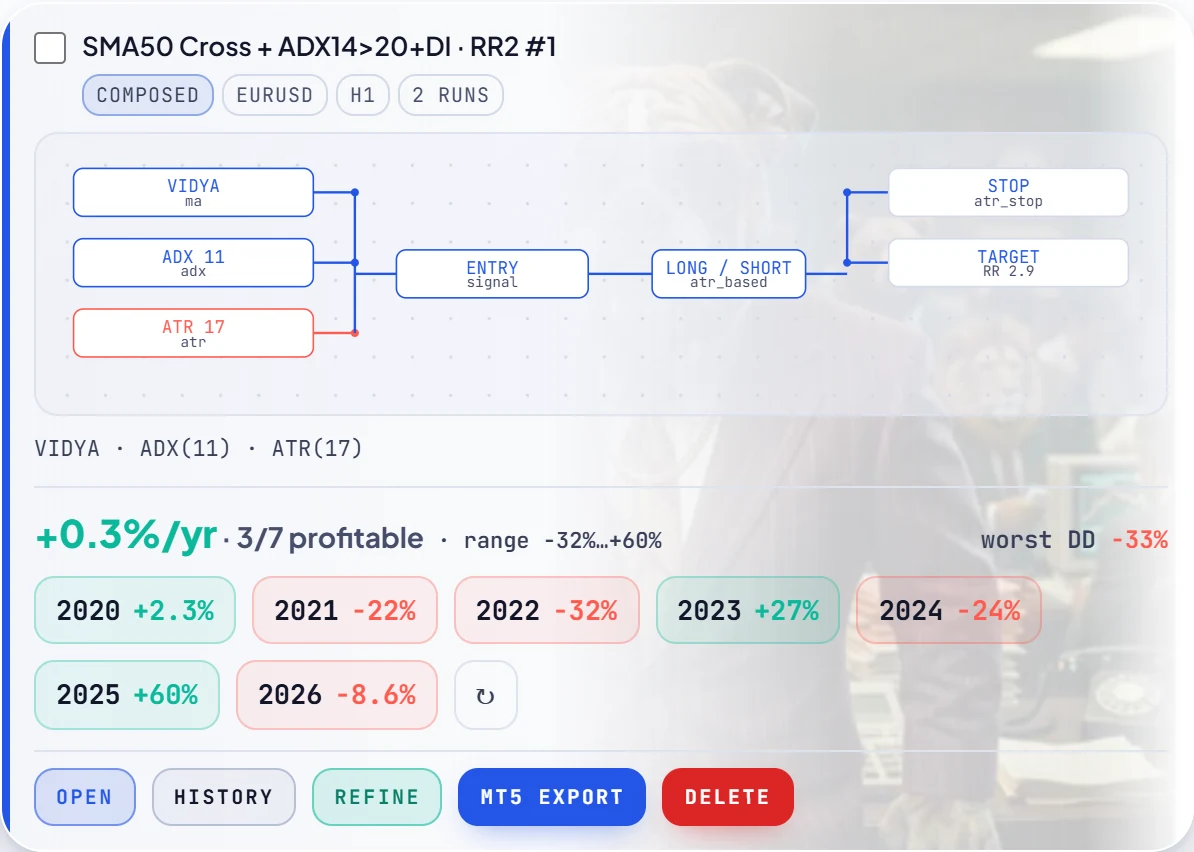
How it works. A trend-following strategy waits for evidence that price has started moving in one direction — a fast moving average crossing a slow one, price above a long average, a strong ADX reading — and joins the move. A momentum strategy is the impatient cousin: it buys after a strong directional push on the bet that the push continues. Losses are frequent and small (most trend signals fail), and the strategy lives on the occasional long run.
Where MACD fits. The MACD crossover is the classic example: buy when the MACD line crosses above its signal line, sell on the reverse. It is a trend and momentum signal in one, and in our template library it shows up most often inside Trend Confirmation, where a second filter has to agree before a trade is taken. We did not break results out by indicator, so we cannot give you a MACD-only number — and we would rather say so than invent one.
| Archetype | What it does | Profitable 6 yrs | Median return | Ruined |
|---|---|---|---|---|
| Momentum | momentum continuation after a strong directional move | 5.2% | -93.5% | 14.2% |
| Trend Confirmation | trend entry requiring two aligned trend filters to confirm (dual-confirm) | 4.7% | -92.5% | 13.5% |
| Trend | trend-following with a moving-average cross gated by ADX | 2.1% | -94.3% | 14.4% |
What our tests showed. Momentum had the best record in the family at 5.2% profitable, against 2.1% for the plain moving-average Trend archetype. Trend strategies on H1 trade a lot — a median of 180 trades a year for the family — and every one of those trades pays the spread. Trend following is the family that most needs a slower timeframe, which is the subject of a whole study of its own.
Family 2
Breakout trading strategy: does it work in forex?
How it works. A breakout strategy draws a box around recent price — the highest high and lowest low of the last N bars (a Donchian channel), the first hour of a session, or a Bollinger band — and enters when price leaves the box. The volatility variants wait for the box to get unusually narrow first (a “squeeze”), on the theory that compression precedes expansion.
| Archetype | What it does | Profitable 6 yrs | Median return | Ruined |
|---|---|---|---|---|
| Volatility Squeeze | trade the release of a volatility squeeze (Bollinger/Keltner compression, TTM) | 4.6% | -87.0% | 9.7% |
| Breakout | breakout on range or channel expansion (Donchian / opening range) | 3.7% | -92.4% | 11.9% |
| Skew Breakout | breakout filtered by return-distribution skew / semivariance | 2.5% | -91.2% | 11.1% |
| Volatility | volatility-driven (Bollinger squeeze / ATR expansion) | 1.9% | -95.1% | 17.0% |
| Volatility Expansion | enter on a volatility expansion / range-bandwidth breakout | 0.7% | -92.4% | 10.6% |
What our tests showed. Breakout was the weakest family overall, at 2.7% profitable. The squeeze variant was the exception inside it: Volatility Squeeze reached 4.6% while Volatility Expansion — which enters on the expansion itself rather than waiting for compression first — managed 0.7%. Entering late on a move that has already started is expensive on a pair as liquid as EURUSD, where breakouts often fail and snap back.
Family 3
Mean reversion trading strategy
How it works. The opposite bet to breakout: when price stretches too far from its average — RSI below 30, price outside a Bollinger band, a stochastic pinned at an extreme — fade it and expect a return toward the middle. Mean reversion typically wins often and small, and loses rarely but large, when a “stretched” market turns out to be the start of a trend.
| Archetype | What it does | Profitable 6 yrs | Median return | Ruined |
|---|---|---|---|---|
| Stationary Reversion | mean-revert only when a stationarity test (ADF) confirms a mean-reverting regime | 8.2% | -80.7% | 9.7% |
| Range Fade | fade the edges of an established range back toward the middle | 5.6% | -86.3% | 12.0% |
| Oscillator | oscillator-based overbought/oversold (stochastic, CCI) | 5.0% | -87.0% | 11.3% |
| Mean Reversion | mean-reversion fading RSI / oscillator extremes | 4.3% | -89.8% | 13.3% |
| Reversion | reversion back toward a statistical mean or value area | 3.6% | -92.2% | 14.7% |
| Divergence | divergence between price and an oscillator | 3.0% | -94.0% | 14.4% |
| Stress Reversion | fade drawdown-stress extremes (Ulcer Index) back toward calm | 2.8% | -89.7% | 11.9% |
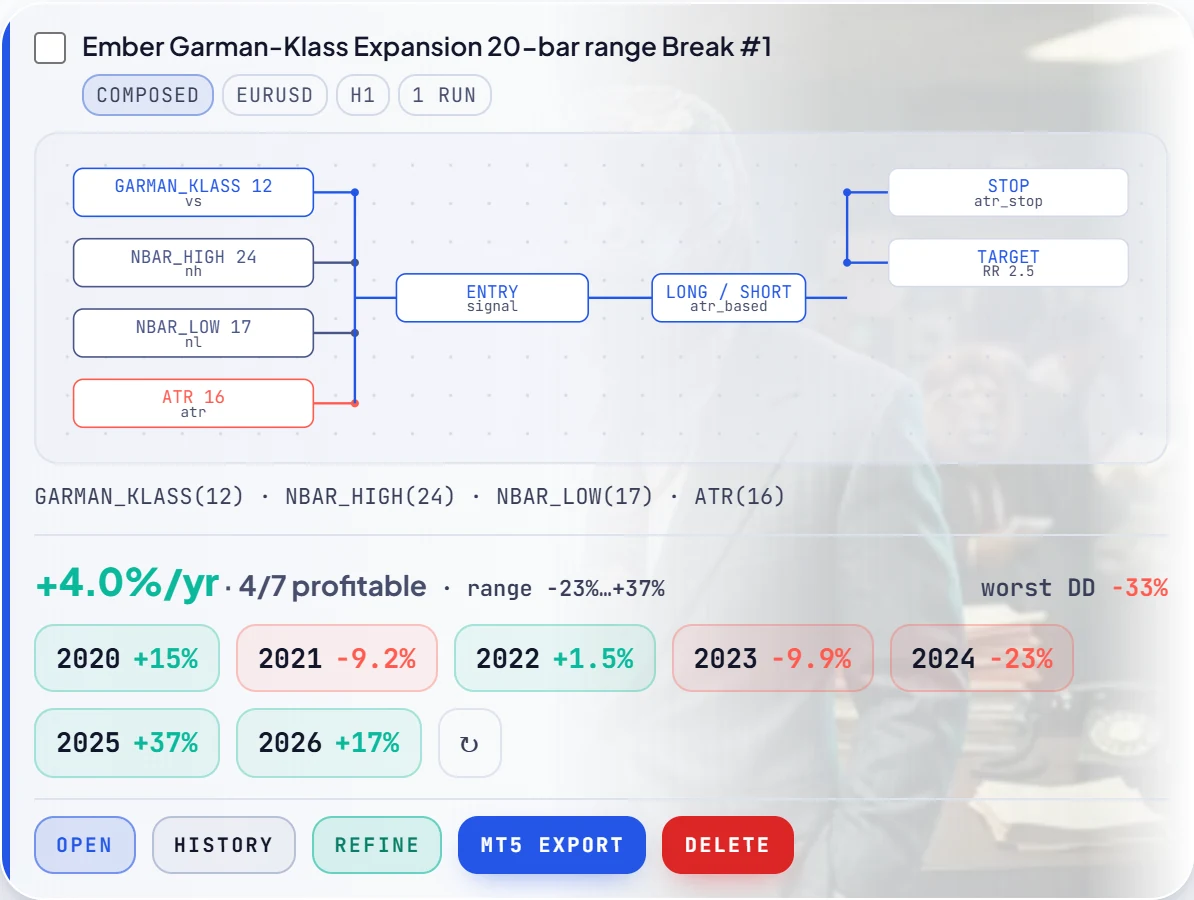
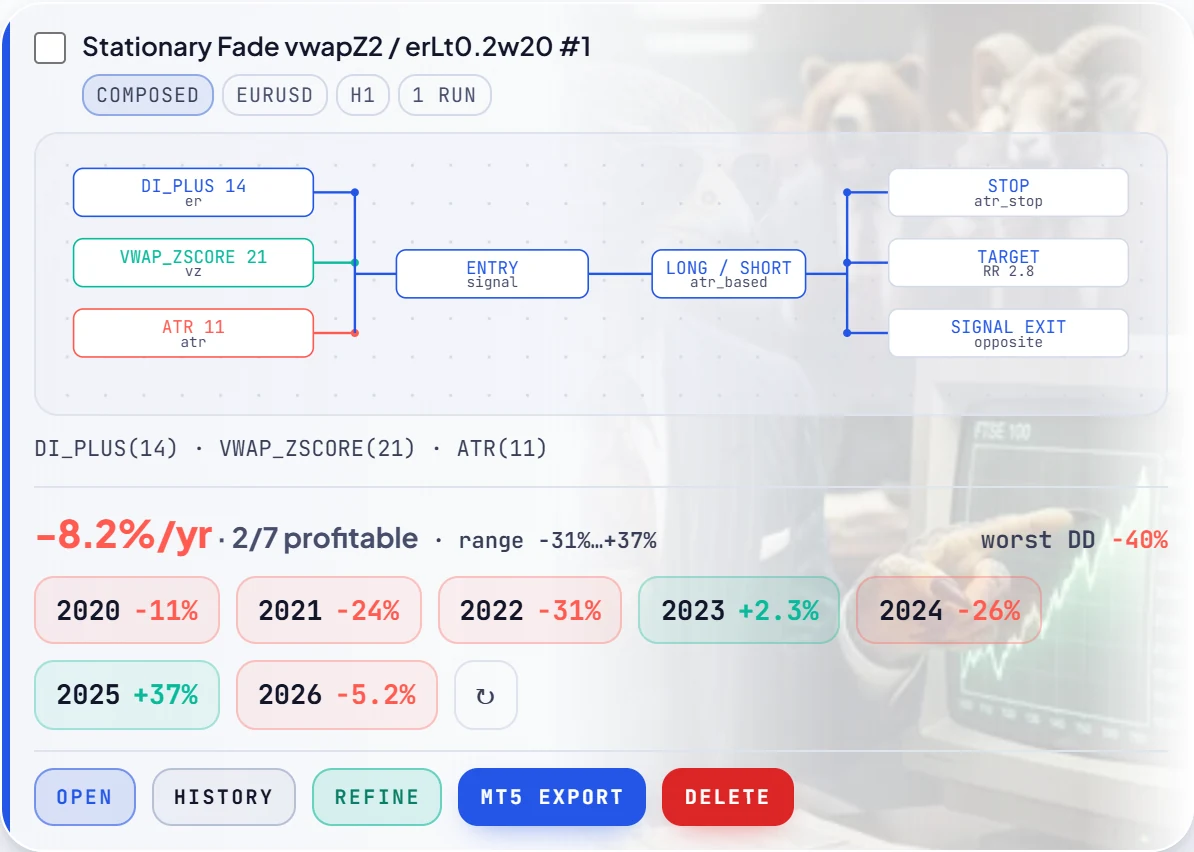
What our tests showed. Mean reversion had the highest profitable share of the six families on EURUSD H1, 4.6% profitable, and its strongest member is instructive. Stationary Reversion only fades extremes after a statistical test confirms the market is currently range-bound, and it reached 8.2% profitable — nearly double the plain Mean Reversion archetype at 4.3%. The improvement came from deciding when not to trade: it took a median of 128 trades a year against 186.
A better archetype is not a better strategy, though. Here is one of ours from that very archetype, on EURUSD H1:
Family 4
Forex day trading strategies: session timing and short timeframes
How it works. Day trading strategies close out before the day ends and usually key off time: the London open, the New York open, the overlap between them. A typical session strategy marks the range of the Asian session and trades a break of it once London opens. Others scalp short timeframes — M5 or M15 — for many small moves a day.
What our tests showed. The Session archetype (session-timed entries, tested on H1) had 1.7% of strategies in profit, with a median of -89.2%. But the bigger issue for day traders is not the entry idea, it is the timeframe. In a separate study we ran the same kind of strategies on every timeframe from M5 to H4, each year from 2018 to 2025 as its own backtest, and measured what trading costs took out of the account:
On M5 the median strategy traded 1,075 times a year and paid 44.1% of the account in costs doing it; its median year returned -99.9%. On H4 the same kind of strategy traded 35 times, paid 1.6%, and its median year was -1.8%. Switch costs off entirely and the M5 median year improves to -48.6% — still negative, so costs are not the whole story, but they are most of it.
That does not make day trading impossible. It means a day trading strategy needs an edge per trade large enough to pay the spread hundreds of times a year, and most do not have one. If you want to day trade with rules, test on real recorded spreads, never a flat assumption.
Family 5
Algorithmic trading strategies: regime filters and statistics
How it works. These are the strategies that are hard to run by hand and easy to run in code. A regime strategy first classifies the market — trending or ranging, calm or volatile — using measures like the Hurst exponent, a stationarity test or a variance ratio, and then applies a trend rule in a trend and a reversion rule in a range. A filter that simply says “do nothing” in the wrong regime counts too.
| Archetype | What it does | Profitable 6 yrs | Median return | Ruined |
|---|---|---|---|---|
| Regime Switch | regime-switching adaptive strategy | 8.9% | -53.2% | 8.3% |
| Regime | regime-gated trend-vs-range router | 5.7% | -89.6% | 12.5% |
| Trend Gate | directional trend entries gated by a regime filter | 3.9% | -90.7% | 11.5% |
| Statistical | statistical regime-filtered edge (Hurst, ADF, variance-ratio) | 3.4% | -88.3% | 11.3% |
| Cycle | cycle / Ehlers signal-processing (super-smoother, bandpass) | 2.0% | -94.5% | 14.5% |
| Regime Router | route between trend and range sub-strategies by the detected regime | 1.6% | -92.9% | 12.8% |
What our tests showed. Regime Switch had the best median of all 34 archetypes, -53.2%, and the highest profitable share, 8.9%. Its median trade count, 132 a year, was well below the population median of 165. Read that carefully: a better median is still a loss. What regime logic buys is fewer bad trades, not a guaranteed edge.
Test a strategy type instead of reading about it
Pick an archetype, generate strategies from it, and see every year backtested separately with the losers left in. Free accounts can compose Trend, Momentum, Trend Confirmation, Mean Reversion; MetaTrader 5 export included.
Family 6
Grid, martingale and other sizing schemes
How it works. These strategies claim their edge from position sizing. A martingale doubles the size after a loss so one winner recovers everything. A grid places a ladder of orders at fixed intervals and lets the basket average its way to profit. Anti-martingale does the reverse, adding to winners. Multi-step strategies scale in and out in stages.
| Archetype | What it does | Profitable 6 yrs | Median return | Ruined |
|---|---|---|---|---|
| Multi-Step | multi-step staged entry and scale-out | 7.5% | -62.2% | 5.2% |
| Anti-Martingale | anti-martingale pyramiding into winners | 6.6% | -97.7% | 24.7% |
| Adaptive Kelly | adaptive Kelly-style position sizing | 6.1% | -83.4% | 11.8% |
| Window | rolling-window statistical state machine | 4.3% | -97.1% | 22.6% |
| Martingale | martingale loss-recovery sizing | 3.5% | -100.0% | 53.2% |
| Protective Stop | protective-stop managed continuation | 1.3% | -94.3% | 12.3% |
| Grid | laddered grid basket | 0.0% | -100.0% | 62.4% |
What our tests showed. This is where accounts went to die. Grid had 0.0% of 2,500 strategies profitable and 62.4% ruined in at least one year; Martingale had 53.2% ruined. Both look excellent most of the time, which is exactly why they are sold: the equity curve is smooth until the one move that does not reverse. Multi-Step’s respectable median (-62.2%) comes with a caveat — 37.2% of its strategies never traded at all, so the ones that did are a filtered set.
Another market
Gold trading strategy: same families, different instrument
Gold (XAUUSD) is the most searched single market for strategy ideas, so we ran a separate study on it: 4,961 strategies across 30 archetypes and six timeframes, each year from 2018 to 2025 as its own backtest — 186,637 runs. Gold’s spread is wide (a median 3.8 pips recorded across the sample) and the timeframe pattern was the same as on EURUSD:
| Timeframe | Median year | Median trades / yr |
|---|---|---|
| M5 | -99.3% | 647 |
| M15 | -78.6% | 415 |
| M30 | -39.8% | 194 |
| H1 | -27.7% | 172 |
| H4 | -4.5% | 54 |
And the most consistent gold strategies the study found looked the same as the best ones on EURUSD: of the 8 it lists — each profitable in at least 5 of 8 years — 6 traded on H4, at a median of 33 to 109 trades a year. They came from different families: Trend Confirmation, Orderflow, Volatility Squeeze, Multi-Step, Cycle, Regime, Oscillator. No family owned the list.
One more number to remember before you buy a gold EA. With trading costs switched off, 65 strategies in this study were profitable in all 8 years. With the real recorded spread charged on the same runs: 0. The full write-up is in our gold EA study.
The pattern
The best forex trading strategies in 2026: what separated the survivors
If the strategy family does not decide the result, what does? Across the studies, the same four things kept showing up.
1. A slower timeframe
Covered above, and the biggest single effect we measured: the median year went from -99.9% on M5 to -13.8% on H1 and -1.8% on H4 on EURUSD, and gold followed the same order. One caution: very slow strategies can look safe simply because they barely trade. On daily bars 74.7% of strategies took fewer than 20 trades over the whole window, which is too few to judge.
2. Fewer, more selective trades
Rank the archetype study’s strategies by their own result and look at how often the top ones traded. The top 5% traded a median of 35 times a year; the whole population, 165. The winners inside each family were the selective ones, too — the stationarity-filtered reversion and the regime switch both traded less than their siblings. Selectivity is not an edge on its own, but every trade without an edge is a guaranteed spread payment.
3. Lower risk per trade
The same rule sets were run at 5 risk levels, so this one is a clean comparison. At 2% per trade, 4.8% finished profitable and 8.2% were ruined in at least one year. At 5%: 3.0% and 24.7%. Raising risk made 94.0% of the paired strategies worse. More risk does not create edge; it widens the outcomes and drags the middle down.
4. A record that travels
This is the uncomfortable one. Picking the top strategies by their own backtest picks the luckiest as well as the best. When we took the top 25 strategies by in-sample return and ran them on 12 instruments they were not chosen on, the H1 group went from +15.25% at home to -18.27% away. Any strategy you shortlist from a backtest — including one from this page — needs to be tested on years and instruments it was not selected on before you trust it. The details are in our study of whether forex robots work.
35 vs 165
median trades a year: the top 5% of strategies vs everyone
4,109 strategies in the top 5% by their own 6-year result, against all 82,170 that traded. EURUSD H1, 2020–2025. This is an in-sample ranking, so read it as a pattern worth testing, not a rule that guarantees anything.
Practical
How to test a forex trading strategy before you trust it
Whichever family you start from, the checks are the same, and you can do them in any backtester:
- Test the family, not one setting. Run several variations of the idea. If only one exact setting works, you have found a fit to history, not a strategy.
- Look at every year separately. A compounded curve hides the losing years. Ask how many of the years were profitable, and look at the worst one by name.
- Charge real spreads. A flat or zero spread assumption creates profits that do not exist, and the effect is largest on the fastest timeframes.
- Count the trades. Under about 20 trades in a year is too few to judge that year.
- Put drawdown next to return. A return quoted without its worst drawdown is half a number.
- Check it somewhere else. Other years, another instrument. A real edge should not vanish completely the moment the data changes.
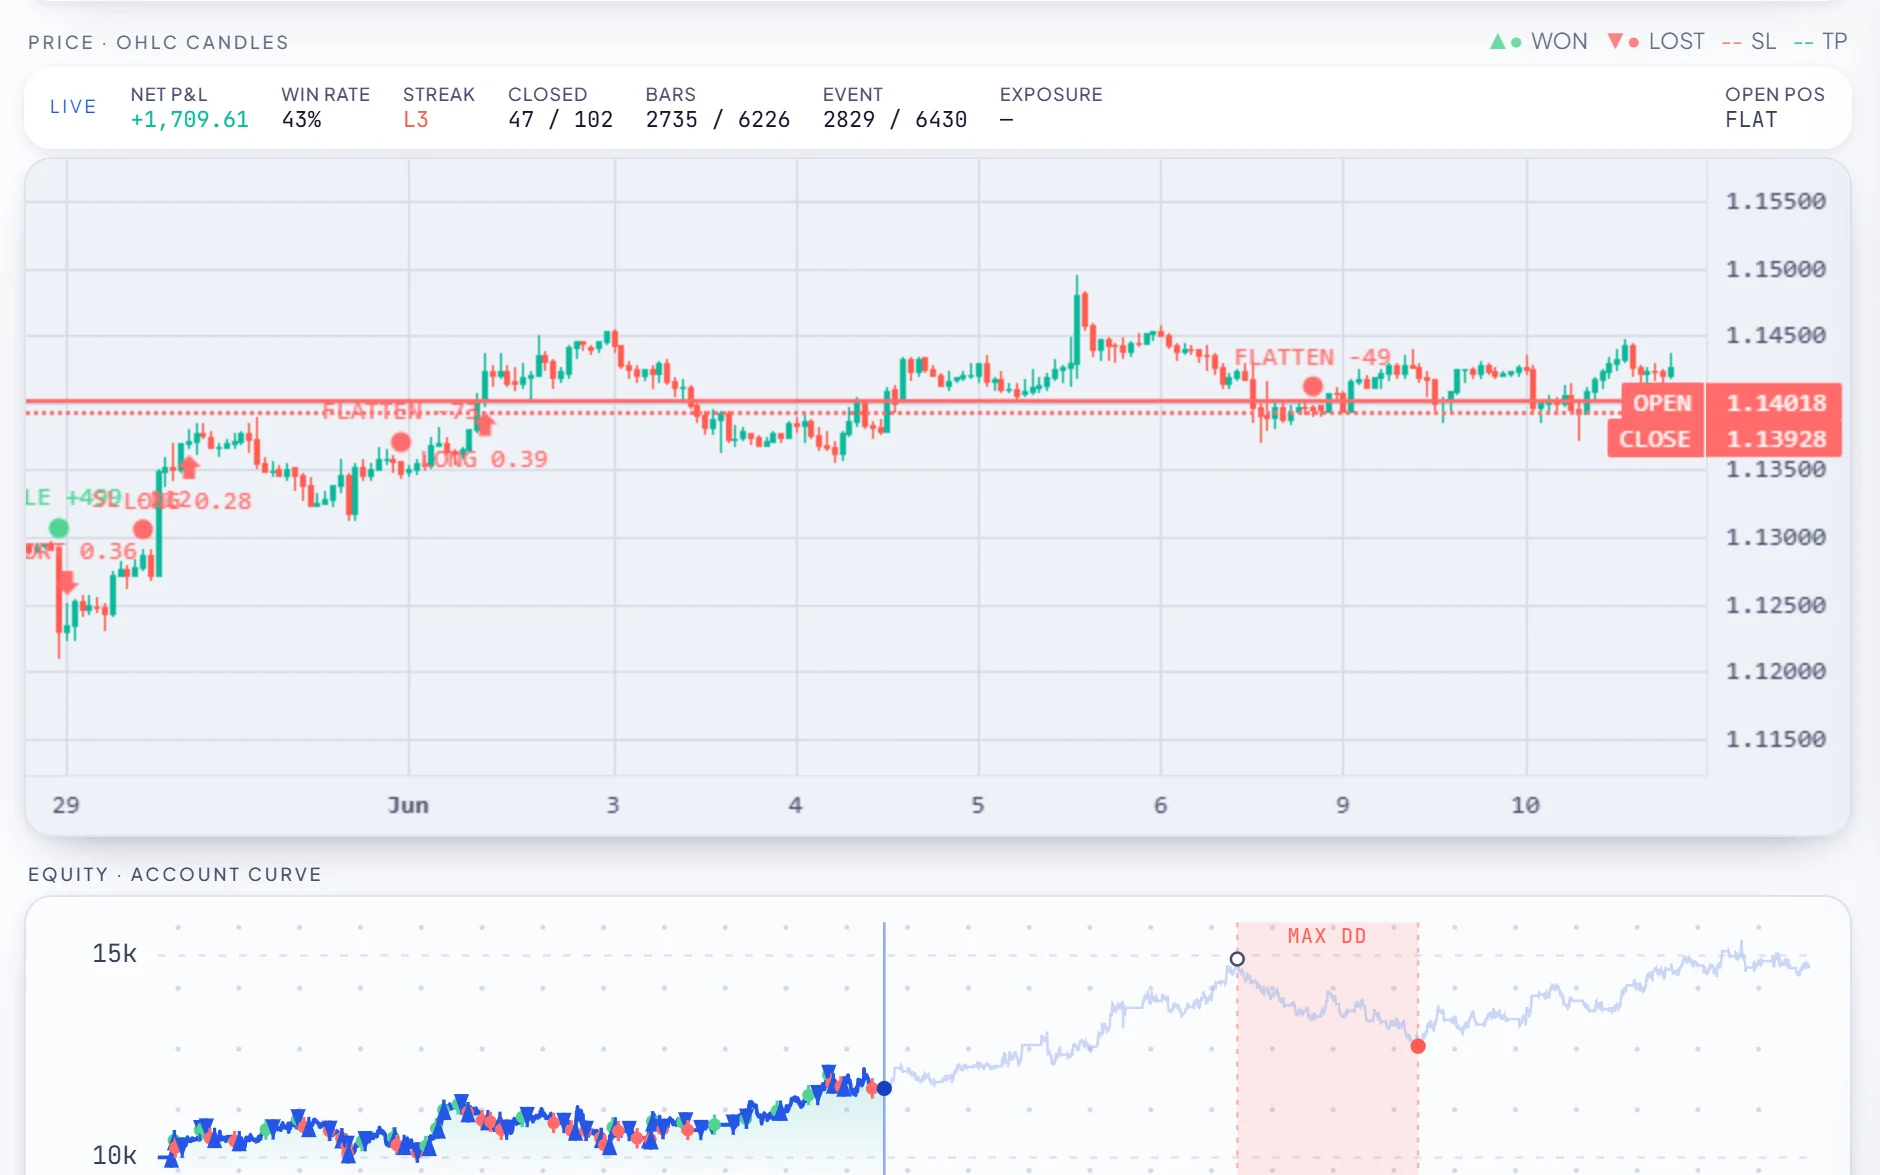
This is the workflow RoboticEA is built around: choose an archetype, generate a batch of strategies from it, backtest each one year by year, and look at the losing years before anything else. The strategies that hold up can be exported to MetaTrader 5 as an expert advisor and tested there too. Here is how the workflow fits together, including the bar-by-bar trade replay shown at the top of this page.
FAQ
Questions, answered
What are the main types of forex trading strategies?
Most rule-based forex strategies fall into six families: trend-following (including momentum and MACD-style crossovers), breakout and volatility, mean reversion, regime and quant filters, structure and flow (price patterns, volume and session timing), and sizing schemes such as grid and martingale. We tested 34 archetypes across those six families, grouped by how the strategy actually trades rather than by which indicator it uses.
What is the best forex trading strategy?
No strategy type won on its own. We tested 34 archetypes on EURUSD H1, each year from 2020 to 2025, with random settings and the real recorded spread, and all 34 had a negative median over the six years. Regime Switch had the best median, -53.2%, and the highest share of strategies in profit, 8.9%. The differences inside a family were wider than the differences between families, so the construction of a strategy matters more than its label.
Does a breakout trading strategy work in forex?
In our test it was the weakest family: 2.7% of breakout and volatility strategies finished six years on EURUSD H1 in profit. The squeeze variant, which waits for volatility to compress before trading the release, did best inside the family at 4.6%, while Volatility Expansion, which enters on the expansion itself, managed 0.7%.
Is mean reversion better than trend following?
Slightly, on EURUSD H1: 4.6% of mean reversion strategies finished six years in profit against 4.0% for trend-following. The gap inside each family was bigger. Stationary Reversion, which only fades extremes after a statistical test says the market is range-bound, reached 8.2%; within the trend family, Momentum reached 5.2% while the plain moving-average Trend archetype managed 2.1%.
What is the best timeframe for forex day trading strategies?
Faster timeframes pay the spread far more often. In our EURUSD timeframe study the median M5 strategy traded 1,075 times a year, paid 44.1% of the account in trading costs, and had a median year of -99.9%. On H4 the median strategy traded 35 times a year, paid 1.6%, and had a median year of -1.8%. A day trading strategy needs a large enough edge per trade to cover that cost hundreds of times a year.
Are grid and martingale strategies profitable?
Not in our test. 0.0% of 2,500 Grid strategies finished six years on EURUSD H1 in profit, and 62.4% lost 95% or more of the account in at least one year. 53.2% of Martingale strategies were ruined in at least one year. Both tend to show a smooth equity curve until the one move that does not reverse.
What is a good gold trading strategy?
In our XAUUSD study the same patterns held: slower timeframes did better, and of the eight most consistent strategies the study lists, six traded on H4. With trading costs switched off, 65 strategies were profitable in all eight years from 2018 to 2025; with the real recorded spread charged on the same runs, none were. Test any gold strategy on real spreads, year by year.
Every number above comes from a study artifact: 594,580 runs on EURUSD (seed 20260808), 33,100 in the timeframe study, 186,637 on XAUUSD and 48,640 on the selection holdouts. All of them are historical simulations. None of them is a forecast, and none of them is a recommendation to trade any strategy described here.
Keep reading
The full archetype study: 594,580 backtests
Every archetype, every risk level: best, worst, most consistent and most likely to blow up.
Which timeframe should a strategy trade?
The effect that turned out to matter more than strategy type, measured timeframe by timeframe.
Do forex robots actually work?
Why the top-ranked strategies stop winning when you move them to another instrument.
Is there a best gold expert advisor?
The 186,637-run XAUUSD study, including what real spread does to gold strategies.
The best forex pairs for expert advisors
The same strategies across many instruments, and how much the pair alone changes the result.
Test a strategy family yourself
Free account, no card. Generate from an archetype, validate year by year, export to MetaTrader 5.